Annotations
Introduction
When viewing a time-series chart, annotations might provide contextual information on series trend at a particular date.
Holistics automatically display annotations on line, area, and column charts that have x-axis datetime.
All annotations you created are listed in a collapsible sidebar to the left of the chart, and relevant annotations are overlaid directly on the chart.
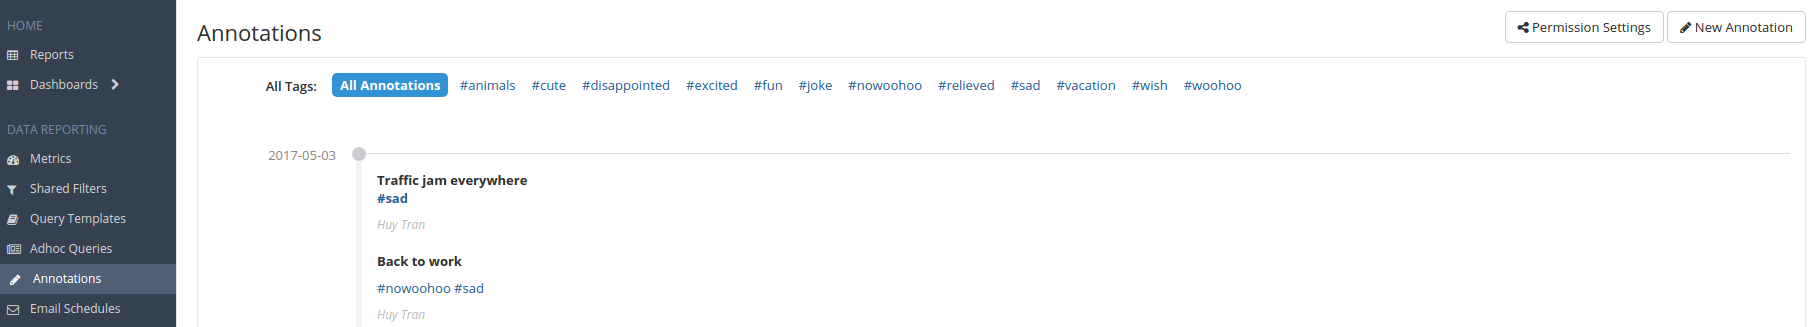
Annotations Page
Please add or edit annotations at this page.
Annotable Charts
If your report has line, area, or column chart with a date x-axis, you can interact directly with the annotations on chart.
The letters on chart represent annotations on that date. You can select the letters and an annotation sidebar will expand and scroll to the selected annotations. All annotations on the same date are selected, and colored blue.
You can view full annotation details by clicking on the annotation title in sidebar.
Sidebar can be collapsed or expanded by clicking on the double arrow at the top.
You can hide annotation letters on chart by toggling the 'Display Annotations' option at the top of sidebar. Toggling the option again to show the letters.