Bar Chart
Bar charts are another commonly used chart type, usually representing discrete data measures such as counts or frequencies as rectangular bars, with their lengths in proportion to the size of the values. Bar charts can be presented as unstacked or stacked to convey cumulative values. Bar charts are presented horizontally, while column charts are presented vertically.
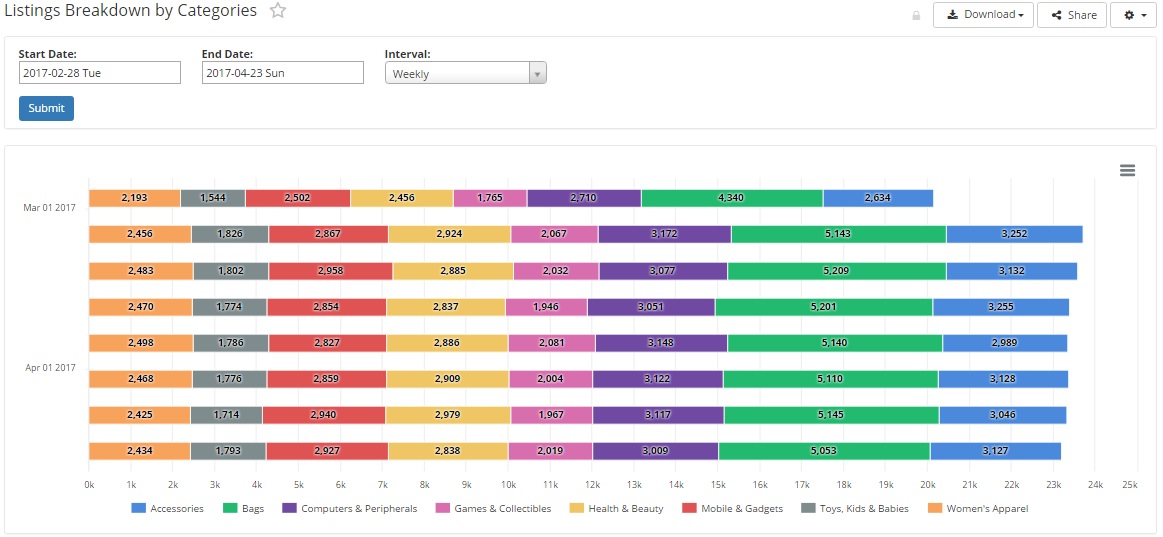
How to Build: Bar chart
Run your SQL query that returns at least 2 columns of values. In this example, we have 9 columns of values, with 1 date column and 8 product listing category columns. This table of values was actually generated using the Holistics 'Quick pivot' feature under the 'Data Settings' section of the Report Editor, for a fast and easy transformation of the data across a column dimension. We specify the data types of the columns within the 'Format Columns' section of the Report Editor. In this example, the 'Date' column uses the date data type, the 'Parent ID' column which contains the product listing categories uses the string data type for its values, and the 'No. of Listings' column uses the number data type. Selecting the 'Quick Pivot' transform feature then produced this data table.

Access the Visualization Editor at the bottom of the Report Editor screen, and select the 'Bar' chart option button. Under 'General', specify which column will be on the x-axis, such as the 'Date' column. As this table of data was built using the 'Quick Pivot' feature, there is no need to specify the columns for the y-axis. Remember to specify if the bar chart is stacked or unstacked, by selecting the 'Bar chart stacking' checkbox under the 'Series' section of the Visualization Editor.
