Holistics Release Notes
This page is replaced by the new Changelog page. You can see list of older changes below.
v1.29 (31 May 2017)
A new visualization! Geographical heat map
We finally released Geographical Heatmap. Geo Heatmap Chart helps you visualize the interesting geographic points and their influence on a map.
Filter jobs by user
Admins can now filter jobs by user at job monitoring page.
v1.28 (16 May 2017)
Display Annotations inside Report's Chart
We finally released Annotations - now not only you can see your chart, but you can make sense of what's happening with it.
Support Data Transform for Qubole QDS
QDS customers now can perform data transform and aggregate the results

v1.27 (11 May 2017)
New layout for report editor page
The new UI will focus on the SQL editor, as long as organizing sections on the report editor page in order to make this page cleaner and easy to use.

v1.26 (25 Apr 2017)
Added option to disable sign-on with username/password
We have added a new section named Security in the Settings page. In this section, you can set the sign in mechanism for your organization.

When Google only option is turned on, all users can only sign in via their Google accounts.

Added query template description
We added Add Query Templates Description functions so you can use it to write description for your query templates. Besides that,
you can hover Content column to preview your query templates query.

Allow mapping to multiple filters for Drilldown
Drilldown now adds an option to allow mapping to multiple filters and multiple columns

v1.25 (13 Apr 2017)
Allowed select view mode and row limit in Dashboard Widget
When you create or edit Report Widget in Dashboard, you can set its view mode to Data Table or Chart

Data Table: Show data table with a specific number of first rows.Chart: Show report visualization configured in report editing page.
Allowed filter by active/soft-deleted users
Now you can filter users by status such as: active, deleted ... at manage users tab.

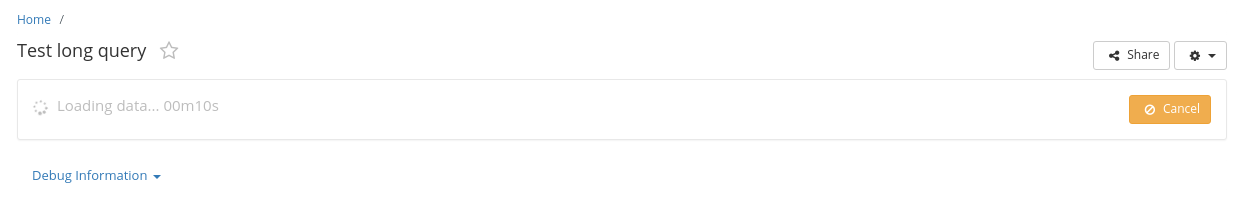
Added ability to cancel running queries
We added Cancel query buttons to Report view and Report editor so you can cancel a running query on your needs.
This is part of the Cancel Running Jobs feature. Read more
Improved Data Import UI, and support source_expression
Data Import now has a more stream-lined UI, and we also support source_expression (what's available in Data Transport).
In upcoming release, you'll see all features of Data Transport to be fully available in Data Import.

Other changes
- Pie chart: Added option to display percentage on label
- Funnel chart: Added option to display both label and value
- Expose Share/Unshare as API. Read more.
- New navigation sidebar
v1.24 (6 Apr, 2017)
Object Locks
Admins or analysts can lock their own reports, dashboards, query templates, .. to prevent other analysts from modifying/deleting the locked objects. Read more.

Display Last Edit For Reports
Now you can see who last edited a report

SSL Support for Presto Data Sources
Presto data sources now support SSL. Ensure that HTTPS is enabled on your Presto server and the SSL checkbox in Holistics data source form is checked and you now can be assured that the connection is securely encrypted!
Notifications
We now have a notification mechanism! You can receive notifications from us in the future.


v1.23 (30 March 2017)
Autocomplete in Report editor
We now support Autocomplete in report editor. This allows users to compose the query easier
Filter Permission Syntax
- We added support for text input filter, now text input filter can also be applied filter permission.
- You can now target a user specifically (previously you can only target them by their group).
- We also refine the syntax to make it more consistent!
See below for an example of what's new:
permissions:
- if_group: Singapore
  then_value: sg
- if_user: [email protected]
  then_value: vn
- if_group: Indonesia
  then_sql:
    ds_id: 25
    query: select country_code from contries where name = 'Indonesia'
For more information, refer to our filter permissions documentation.
Other Changes
- When sharing a dashboard to a business user, All reports/metrics inside it are not shared
- Fixed client side polling not using correct job id in case of already existed job
v1.22 (Mar 23 2017)
Freeze Table Headers
Table headers inside query reports are now frozen for better data browsing
Other Changes
- Upgrade Sidekiq, allow background worker to restart gracefully
- Allow admins to set visualization records limit
v1.21 (Mar 16 2017)
Support Presto Qubole data source (QDS)
We have recently added support for Qubole and their QDS data infrastructure. Customers who are using Qubole can now use Holistics as a Reporting front-end on top.
Other Changes
- Admin has no longer to wait the invited user to activate his/her account before editing/setting user group.
- Fix Scatter chart, Funnel chart, Pyramid chart not rendered in email service
- Fix data sources not loaded in report editing
- Fix date format not correct in daily count widget when using insight generator
v1.20 (Mar 9, 2017)
- Now you can invite a user without assigning a password. He/She can set the password later.
- Support chart customization for specific tenant in super admin page
- Data Import: Now we support auto-typecasting for database table source
- Data Transport: Added support for copying
JSONdatatype to Postgres - Fixed bug with schedule UI
- Fixed date-range filter mixed-up panel
- Support logarithmic scale for y-axis chart
v1.19 (Mar 2, 2017)
Scatter Chart Input Data Format
Scatter Chart data format is friendlier to work with. Read more

Change Query Template Syntax
For consistency and analyst's happiness, we changed the query template's usage syntax from {{{ template_name() }}}
to {{ @template_name() }}. This change is to bring a consistent interface to variable interpolation ({{ }}).
The old syntax is still supported until deprecation.
Automated Dashboard Generation
We added support to allow you to auto generate a dashboard out of a database table. This is great to help you get started quickly with a dashboard of your own data.
See a quick video below:
Other Changes
- Support {{ $UTC_NOW }} macros which will return text representation of current utc datetime
- Fix unauthenticated adhoc query link not redirect to the login page
- Added retry mechanism in email delivery (to prevent timeout from 3rd party email service)
- Fixed bug
this month beginreturns wrong data - Support
No attachmentoption in email scheduler - Fixed chart preview not show in report email
- Fix mysql datetime auto casting not in 'YYYY-MM-DD HH:MI:SS' format
- Fixed data imports show loading
- Allow query template list in report editor to be scrollable
- Fix multiselect dropdown filter not working with values containing double quotes
- New Feature: Dashboard Generator!
- Fix NaN% value in metric widget tooltip
v1.18 (23 Feb 2017)
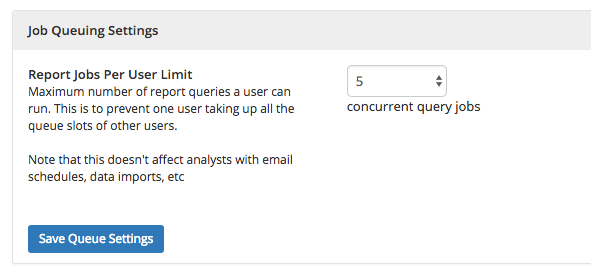
Limit Concurrent Report Jobs Per User
We released a feature to allow admins to control how many report queries can be submitted by users concurrently. This value can only be set by admins. Learn more
Support Color Palette for Pie Chart
We added color palettes, allow you to build your own color pattern to apply to charts. Read more

Better Display of Metrics in Dashboard
We now show how much a particular metric has changed compared to previously in the dashboards. Read more

Other Changes
- Shared Filters page now show list of reports/dashboards using the filter
- Fixed editing metric UI layout bug
- Display % change in metric dashboard
- Fix pivot table header not spanning correctly when sub dimension has repeated values.
- Fix broken metric editing page layout
v1.17 (14 Feb 2017)
Happy Valentine's Day! Please find below our changelog for this release:
Pivot Table Visualization
We added pivot visualization, allow you to build more complex table visualization inside your report! Read more.
Other Changes
- Confirm dialog now support keyboard shortcut Enter
- Data Import/Transport: Support loading data to Amazon Redshift in all regions
- Drilldown now carries all current selected filter values over to destination report
- Fixed: editor jumping issue, no more jumping around!
- Fixed: dashboard email now formats metric nicely
- Fixed issue with adding text widget to dashboard
- Fixed issues with date range filter type
v1.16 (6 Feb 2017)
Beta Version of Embedded Analytics
We launched embedded analytics, allowing our customers to build reports and embed them directly into their own CRM application! Read More.
Improved UI for Data Import

Other Changes:
- We now support Query Templates in Query Metrics
- Better UI when hovering through data table row
- Bug fixes and code refactoring
v1.15 (17 Jan 2017)
Support Bubble Chart
We added support for Bubble Chart!

Other Changes
- You can now sort/paginate Data Imports/Transforms page so navigation is much better now
- Moving to soft-delete for users, so that you can restore a deleted user later on when needed.
v1.14 (Jan 04, 2017)
Chart and report share the same column formatting
Chart tooltips, data labels and x-axis labels now use the same column format set in report.

Dashboard Auto-refresh
Dashboard can be set to auto refresh within a given interval. This allows you to project dashboard onto large screen and let it run without further manual intervention.


Search and filter jobs
Admin management page, and job history supports search and filter for jobs.


Bug fixes and optimization
- Optimize job locking logic
- Fix job ordering issue
v1.13 (Dec 15, 2016)
Support Data Imports for Presto Data Source
Customers now can use Data Imports feature for Presto data source.
Setting Filter Values for Report Widgets
Now, when adding a report widget to a dashboard, you can set a custom filter value for the report. This allow you to create one report that can be added multiple times to a dashboard with different filter values.
Example: a dashboard with both "Vietnam Sales" and "Singapore Sales" can come from the same report (Sales).

Email Schedules' Sender Info
You can now set custom email sender names tailored to your company's branding.

Email Schedules page for analysts
We now expose Email Schedules manager page to Analysts role, and restrict them to only email schedules that analyst has access to (the corresponding reports/dashboards).
Bugfixes + Other Changes
- Fixed: report editor's category dropdown now doesn't cut off words
- More friendly report waiting message
- Fixed: auto-casting bug for string columns
v1.12 (Dec 05, 2016)
Support Data Transform for Presto
Presto customers now can perform data transform and aggregate the results
Support HTML string column
String column now has 2 format types: string and html. String format type escapes html characters in string content,
while html type allows you to input HTML content.

Bugfixes + Small Changes
- The first data source added by users will be set default automatically
- Fixed: in the report view page, while waiting for report to load, we now display number of jobs ahead correctly.
- Fixed: previously when cloning a report, the adhoc filter is being shared between 2 reports, changing one will change the other, now that's fixed!
- Fixed: incremental transport/import now escape single quote properly for string-based increment column
v1.11 (Nov 24, 2016)
Things are now rearranged a little bit, so you’ll have a smoother navigation experience, especially with dashboards!

We now support Markdown for report’s description!

Bugfixes:
- Fixed: drilldown now works in dashboard as well
- Fixed: Lazy adhoc dropdown in report now works properly
- Fixed: search report can now go deeper than 3 levels
v1.10 (Nov 2, 2016)
We now show an "Owner" column in report browsing page to enhance the management experience.

We also introduced a new Onboarding process, hoping to help our users be more familiar with the software. New users (admins, analysts, users) will be prompted with this dialog.

Refactoring + Fixed:
- Rewrote the backend code for report formatting code (so it's faster and more consistent now)
- Fixed: bugs related to data displaying
You can now invoke your email schedule manually with our Holistics CLI. This is helpful when you want to invoke an
email schedule after a certain data job has run on your side. Remember to upgrade your holistics gem before running.
$ holistics email_schedule trigger <email_schedule_id>
v1.9 (26 Oct 2016)
The main change of this release is to add support for Presto database. Now you can connect to your Presto cluster and build reports/dashboards from that.
![]()
We also made a few performance improvements across the board. Now filters, report executions and loading are also much faster.
v1.8 (18 Oct 2016)
We have improved our visualization editor page, now there’s a single unified interface for you to design your visualization.

A logging message is added to job’s logs when someone manually cancel the job. This release also came with lots of bug fixes and refactoring.
v1.7 (8 Oct 2016)
- Data Transform: Support incremental transform
- UI: Improved report editor page
- Notification: Send email notifications to owners when data imports or email schedules fail
v1.6 (1 Oct 2016)
- Visualization: Add option to group long-tail of quick pivot chart to "Others" group
- Data Transport: Support moving data to SQL Server database
- Fixed: Bug where data import last file in Google folder doesn't work with XLS
- Fixed: bugs related to email schedules
v1.5 (22 Sep 2016)
- Visualization: Improved chart’s visual look!
- Report Query: Report’s query doesn’t parse commented out query template anymore.
v1.4 (15 Sep 2016)
- Data Import: support new source - GDrive Folder, it’ll automatically find the most recent csv/xls file in the folder and import
- Report Query: support spaces between double brackets and variable names, so that it’ll look easier on the eye. E.g.: {{ start_date }}
v1.3 (9 Sep 2016)
- Data Import: add support for incremental data import
- Report Editing: strict validation of filters names (ensure no duplications)
- Report Editing: better icons for schema explorer
- Add link to release notes on app’s footer
v1.2 (5 Sep 2016)
- Dashboard Email Schedule:
- Ability to specify which widgets to be included in the email
- List of reports/metrics now follow order specified in the dashboard
- List filter: add an optional setting to set limit for number of input items
- Invite User: send an invitation email to user after inviting
- Allow admins to change default report cache duration
v1.1 (25 Aug 2016)
- Performance: Performance optimization for permission checking
- Report View: Shorten report request with very long query string (> 500), so that it doesn’t exceed HTTP GET request limit
- Transport: support incremental transport with existing rows (upsert)
v1.0 (23 Aug 2016):
We’re hitting v1.0 with a totally new look and feel.
- UI: Totally new look & feel
- Report Email: Display filter parameters inside the email
- Report/Dashboard Email: Utilize more space of email body on wide-screen devices
- Report View: Display table columns prior to running reports
- Report View: Cache sort preference on query report data table. Cache is deleted after closing current browser tab
- Drilldowns: First version of drilldowns, allow reports to be linked to other reports
- Visualization: Deprecate dual_axis chart type (remove from list, existing ones still work), dual-axis chart can be done using multiple axes settings in Chart Settings.
- Parent-child Filters: child filter values don’t get interpolated by parent filter’s selection
v0.2.23 (17 Aug 2016):
- *Dashboard Email: *Scheduled Dashboard Email now display all the dashboard’s items data inside the email.
- *Kill Individual Job: *Admins can now kill an individual job. Note that right now only job that hasn’t started running can be killed.
- *Displaying JobID to Business User: *We now display the Job ID of the report query to business user, so that when there is a problem, he can report that JobID for data team / support team to easily locate the troubling job.
- Data Transport: Add column mapping support for PostgreSQL to SQL Server
- Data Import: Support API endpoint for CSV import
- *Dropdown Filter: * User now can specify filter caching schedule for dropdown filters
- Dashboard: Sort list of dashboards alphabetically
- Adhoc Queries: perform query validation before submitting the query to reduce syntax error chance
- UI: Adjust shared filter edit dialog alignment
v0.2.19 - Fri, July 7 2016
- Transport: Support MongoDB source, now you can transport data from MongoDB into your analytics database
- Dashboard: Support automated email schedule, so that you can set an dashboard to be emailed to your users regularly.
- *Viz: *Support stacking for mixed-type visualization
- Viz: Support percentage display for stacked bars and columns
v0.2.18 - Wed, Jun 29 2016
- Allow user to drag and drop to rearrange filters in report form
- Add support for text widget (with markdown)
- Add support for multi-type chart
- Add queue2 for Grab
- Add usage pages for holistics objects
- Allow grouping of long-tail items in charts
- Add job log for “Email myself” feature
- Fix bug where permission syntax text box needs extra click to be activated
- Fix bug where chart DSL settings do not apply for email schedule
- Fix bug where cloning report does not bring filters over
v0.2.17 - Wed, Jun 22 2016
- Unify shared/adhoc filter to use SharedFilter model
- Refactor report visualization to a new attribute “viz”
- Allow user to bust individual filter cache
- Allow editing of dashboard’s filter
v0.2.16 - 07/06/2016
- Redesign report’s editor filters tab
- Add API endpoint to generate transport configs files
- Support deletion of adhoc queries
Hot Fixes - 01/06/2016
- Fix issue with multiple-dropdown child filter
v0.2.15 - 30/05/2016
- Add date range filter
- Add post transform query
- Support invoking transform job via holistics command line tool
- Preview panel supports horizontal scrollbar when table gets too wide
- Report editor form add buttons to insert filter variables and query templates
- Bugfix: Adhoc query form selects default data source
- Fix bug where chart does not show error message when number of points exceeds limit
- Fix bug where single value dashboard widget shows number of rows
v0.2.14 - 19/05/2016
- Fix support for BigQuery connector
- Fix issue with email schedule fail to generate chart
- Add Recent Reports feature
- Move top menu to the left
- Support BigQuery reporting (schema explorer)
- Support BigQuery destination
- NUX: Add guide to create data source
v0.2.13 - 11/05/2016
- Rename denormalize to quick pivot, add inline help
- Support Redshift source for data transport
- Improve data imports/transforms UI (relative time, add destination table column)
- Fix issue when cloudflare caches static content after deployment
- Support SqlServer for data reporting
v0.2.12 - 3/5/2016
- Add "Used In" column in Query Template listing page
- Parameterized query template feature added
- Parent-child filter feature added
- Each tenant now queues next jobs independently from each others
- Rename "Private Link" to "Shareable Link"
- Fix issue where "public user" is shown in the list of shared users/groups
- Redshift data transport destination works correctly with dist key and sort keys
v0.2.11 - 20/4/2016
- Email schedules add options to "show report link"
- Add option to run 'non-select query' for adhoc queries
- Ability to create private link that allows anyone to view shared dashboard is added
v0.2.10 - 13/4/2016
- Fix issue with chart xAxis date format
- Add support for query template feature
- Make breadcrumb loads with Ajax
v0.2.9 - 6/4/2016
- Add support for incremental transports
v0.2.8 - 31/3/2016
- (Internal) Adhoc queries change URL, change model name (Query to AdhocQuery)
- Various UI fixes/improvements
- (Internal) Change URLs and model names for adhoc queries
- Edit category in an inline dialog
- Adhoc queries form turned into angularjs form
- Ability to rename dashboards
v0.2.7 - 23/3/2016
- Ability to toggle sidebar navigation
- Support inline editing of report's title
- RedshiftDest - MAXERROR = 0
- Adhoc Queries use new abstraction layer
v0.2.6 - 16/3/2016
- Chart series retains selection across page refresh
- Improved report editor schema explorer sidebar, now it is smoother, search-highlighting and more UX-friendly
- Support mysql as a transport destination
- Memory optimization for data transport of mysql source
- Email schedule: allow option for email not be sent when there's no data
v0.2.5 - 9/3/2016
- We've made all reports now to have pagination to avoid large resultset to crash the users' browser.
- Add row limit for report query. The limit can be configurable for each tenant.
- Job re-execution is now limited to 3 times by default and configurable
- Data transports/imports now use an in-house intermediary format (HIF) instead of CSV.
v0.2.4 - 2/3/2016
- Email schedule: Add Recipients Management dialog (allow 1-click removal of an email addresses from all schedules)
- Email schedule: Add Edit capability to email schedules list (Admin > Email Schedules)
- Email schedule: Checkbox option for showing/not showing preview chart and data in email body
- Email schedule: Add option for showing/hiding attachment's column headers
- Email schedule: Allow editors to specify BCC recipients
v0.2.3 - 23/2/2016
- Unify timezone management
- Report emails now will show chart + data table
- Move data source editing form to Ajax
- Allow admins to pick a default data source
- Upgrade to highcharts v4.2.3
- Add validation for data imports to avoid cases when one column is blank
v0.2.2 - 18/2/2016
- Unify schedule UI for both daily/weekly/monthly and cyclic schedules
- Upgrade to ruby 2.3
- Introduced ModelMetric
- Redesigned of query report editor page
- Change the way adding sql limit works
- New charts: Combo Dual Axis, Pyramid, Funnel
- Collect a few stats for report executions
- Auto-refresh job history listing
- Data Import now can be scheduled to run at specific interval or time
- Excel/CSV file generated will be uploaded to S3 for big result set
v0.2.1 - 28/1/2016
- Supports creating indexes for Postgres destination (data transport)
- Open up Metrics feature with simple metrics listing page
- Support noquote for filter variables
- Move parsing of timestamps from server to clients
- Support MySQL for schema explorer, data import, data transforms
- Added retention color heatmap
- Added Zoom-in on charts
- DataSource: (tenant_id, name) is now unique
- Better icon sets for reports
- Use original field types in denormalized case
- Support Week/Month under Date type
- Dashboards moving to async polling of report items
- Move rendering of report results to frontend
- Analysts now have access to Data Import and Data Transformation features
- Fix bug where report search box results can't be clicked on
- Automatically convert URL strings in result table to clickable links
- Remove number format for Excel generation
v0.2.0 - 7/1/2016
- Incorporate new job abstraction layer
- Fix regression bug causing bust cache to fail
- Add Duration column to Jobs Listing
v0.1.5 - 5/1/2016
- Restyle schedule dialog
- Add scattered plot
- Add ability to export charts to PDF/PNG/JPG/SVG
- Move to better looking confirmation dialog
- Better job's logs dialog
v0.1.4 - 28/12/2015
- Move to Sidekiq Pro for better reliability
- Fix some minor issues
v0.1.3 - 25/12/2015
- Fix issue where domain parameter is silently ignored when trying to export to Excel
- Support mysql for thor tenant:dbconsole
- Improved Schema Explorer
- Email excel report for huge result set
v0.1.2 - 22/12/2015
- Adding version to /i route
v0.1.0 - 22/12/2015
- First official release